# Spatial Memory
Python
```python
import pickle
from dimos.mapping.pointclouds.occupancy import general_occupancy, simple_occupancy, height_cost_occupancy
from dimos.mapping.occupancy.inflation import simple_inflate
from dimos.memory.store.sqlite import SqliteStore
from dimos.memory.vis.color import Color
from dimos.memory.transform import downsample, throttle, speed, smooth
from dimos.memory.vis.space.space import Space
from dimos.utils.data import get_data
from dimos.memory.vis.space.elements import Point
```
we init our recording, investigate available streams
```python
store = SqliteStore(path=get_data("go2_bigoffice.db"))
for name, stream in store.streams.items():
print(stream.summary())
```
```results
Stream("color_image"): 4164 items, 2025-12-26 11:09:08 to 2025-12-26 11:14:00 (292.5s, 14.23 Hz, 133.76 MiB)
Stream("color_image_embedded"): 267 items, 2025-12-26 11:09:12 to 2025-12-26 11:14:00 (288.4s, 0.92 Hz, 12.14 MiB)
Stream("lidar"): 2251 items, 2025-12-26 11:09:08 to 2025-12-26 11:14:00 (292.3s, 7.70 Hz, 320.76 MiB)
Stream("odom"): 5465 items, 2025-12-26 11:09:08 to 2025-12-26 11:14:00 (292.5s, 18.68 Hz, 458.97 KiB)
```
Any stream is drawable
```python
global_map = pickle.loads(get_data("unitree_go2_bigoffice_map.pickle").read_bytes())
drawing = Space()
# this is not necessary but we use a global map as a nice base for a drawing
drawing.add(global_map)
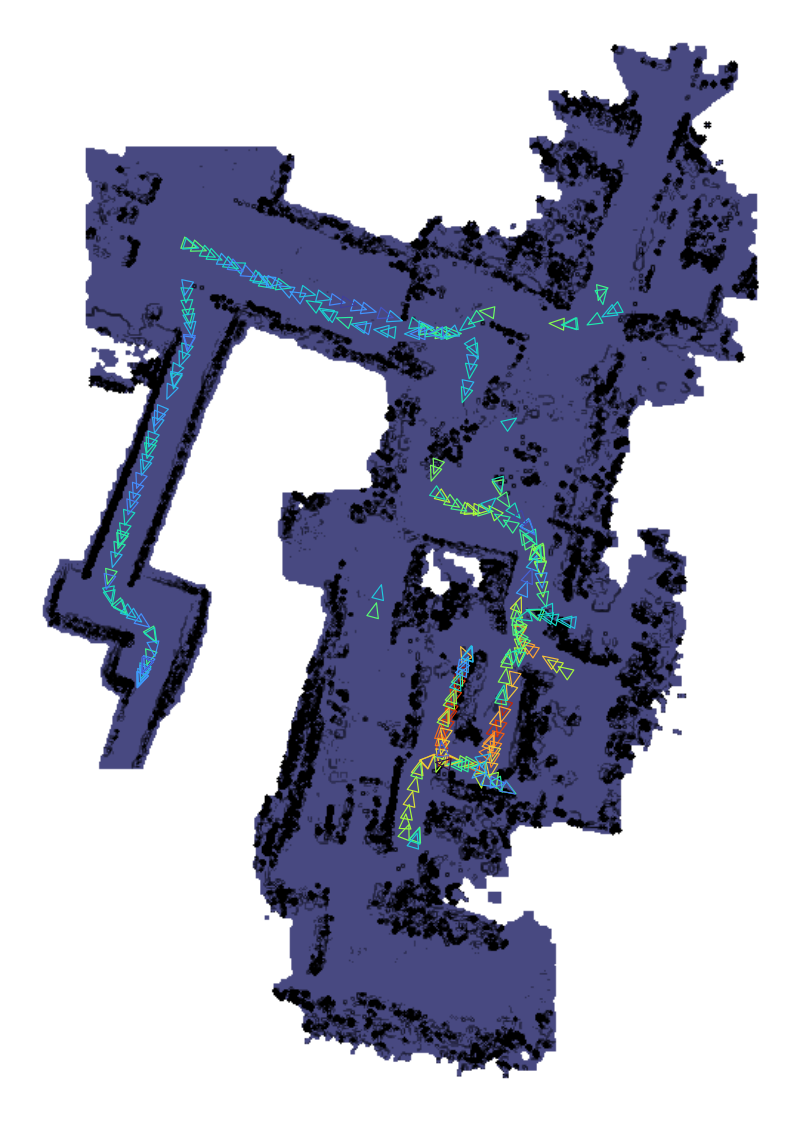
drawing.add(store.streams.color_image)
drawing.to_svg("assets/color_image.svg")
```
our drawing system applies turbo color scheme to timestamps by default
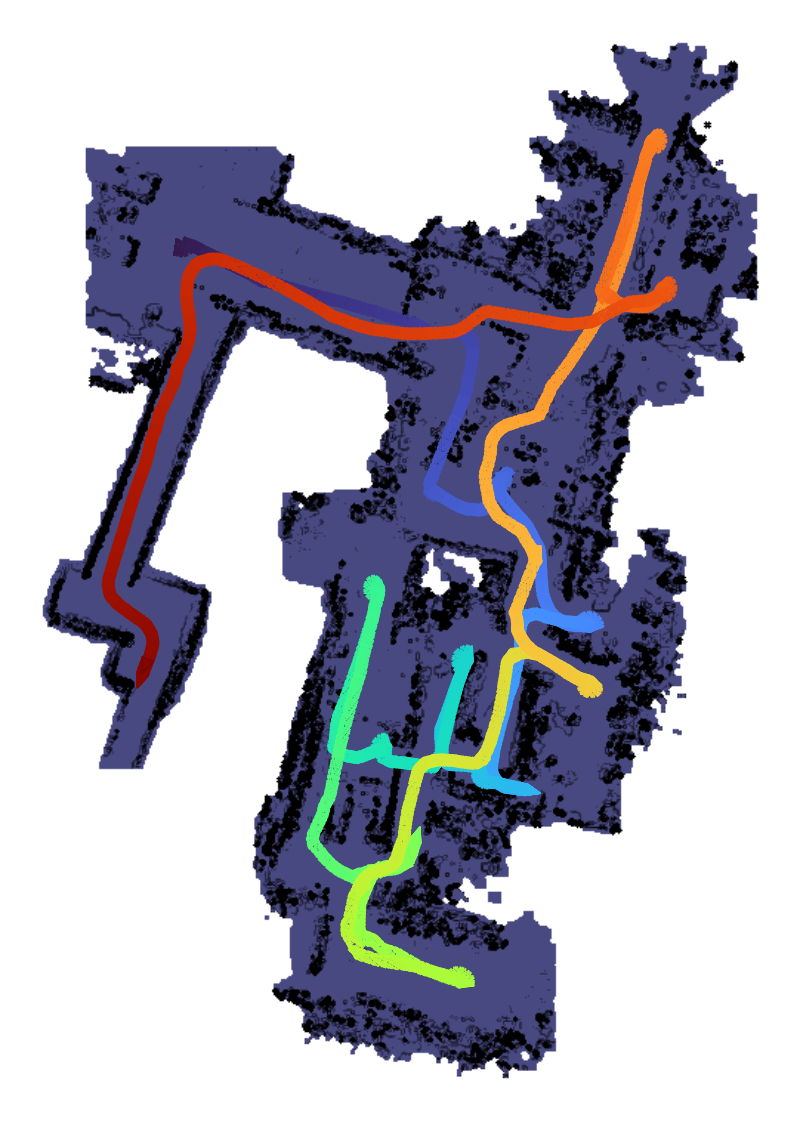
we can create new streams by querying existing streams, and we can save, further transform or draw those
```python
drawing = Space()
drawing.add(global_map)
drawing.add(
store.streams.color_image \
# calculate speed in m/s by checking distance between poses and timestamps of observations
.transform(speed()) \
# rolling window average
.transform(smooth(50)))
drawing.to_svg("assets/speed.svg")
```
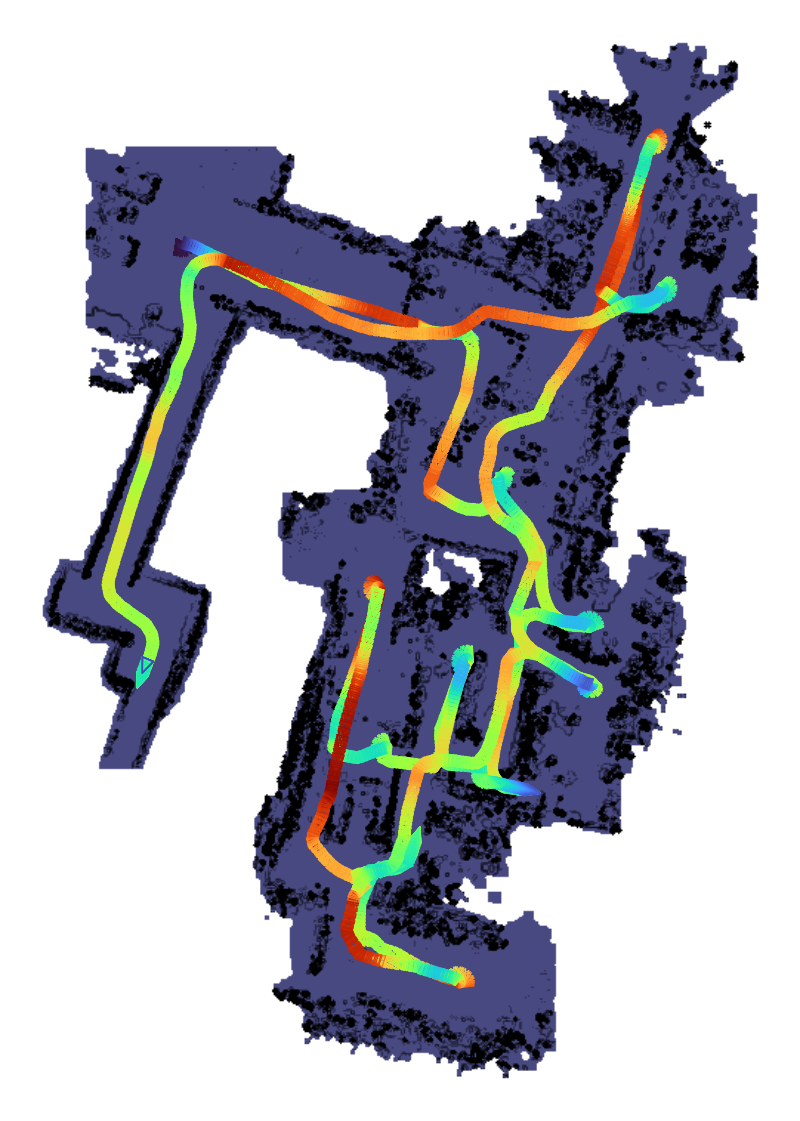
we can do all kinds of things with this, for example map out room lighting
```python
drawing = Space()
drawing.add(global_map)
drawing.add(
store.streams.color_image \
# here we will take 4fps because brightness calculation loads the actual image
# observation.data triggers another db query to fetch the data
# otherwise observations only hold positions and timestamps
.transform(throttle(0.25)) \
# we calculate brightness
.map(lambda obs: obs.derive(data=obs.data.brightness)))
drawing.to_svg("assets/brightness.svg")
```
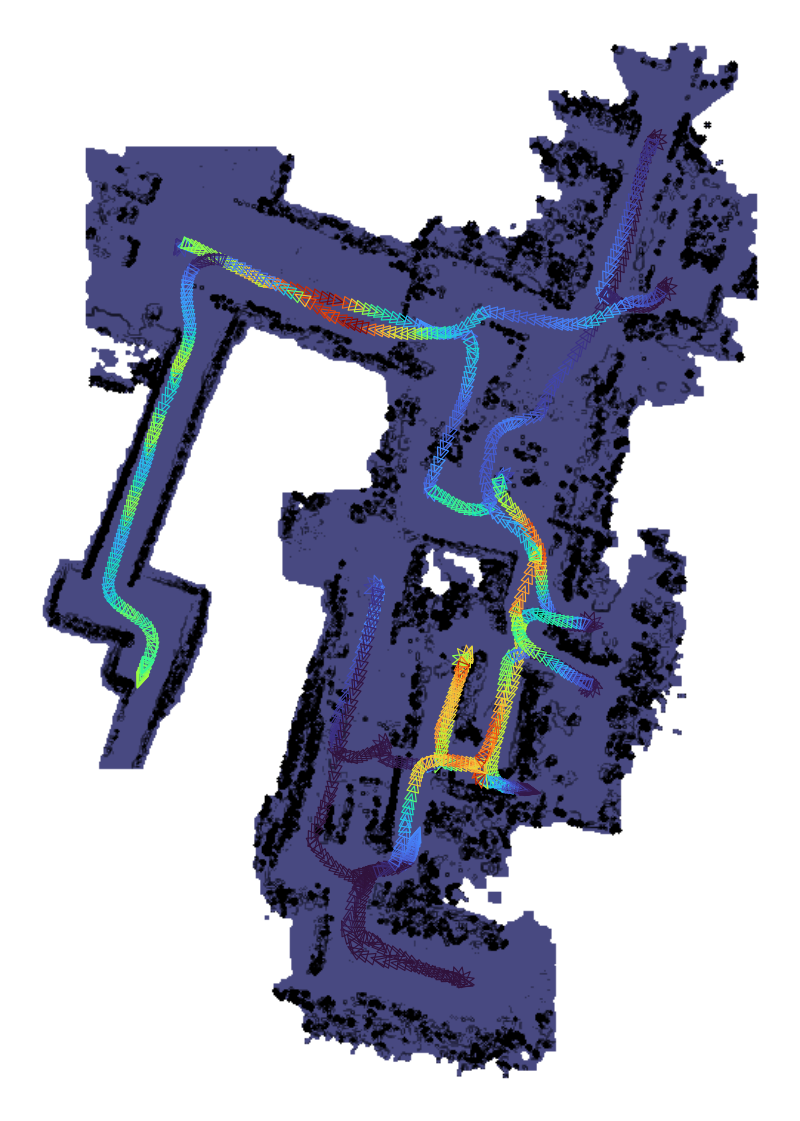
So knowing above, we can create embeddings for the full stream,
```python
from dimos.models.embedding.clip import CLIPModel
from dimos.msgs.sensor_msgs.Image import Image
from dimos.memory.transform import QualityWindow
from dimos.memory.embed import EmbedImages
embedded = store.stream("color_image_embedded", Image)
clip = CLIPModel()
# Downsample to 2Hz, filter dark images, then embed
pipeline = (
store.streams.color_image.filter(lambda obs: obs.data.brightness > 0.1)
.transform(QualityWindow(lambda img: img.sharpness, window=0.5))
.transform(EmbedImages(clip))
.save(embedded)
)
print(pipeline)
```
this pipeline is ready to execute by lazy, we can execute it by iterating, or calling .drain()
```python
for obs in pipeline:
print(f" [{count}] ts={obs.ts:.2f} pose={obs.pose}")
```
let's query it!
```python
from dimos.models.embedding.clip import CLIPModel
drawing = Space()
drawing.add(global_map)
clip = CLIPModel()
search_vector = clip.embed_text("shop")
drawing.add(store.streams.color_image_embedded.search(search_vector))
drawing.to_svg("assets/embedding.svg")
```
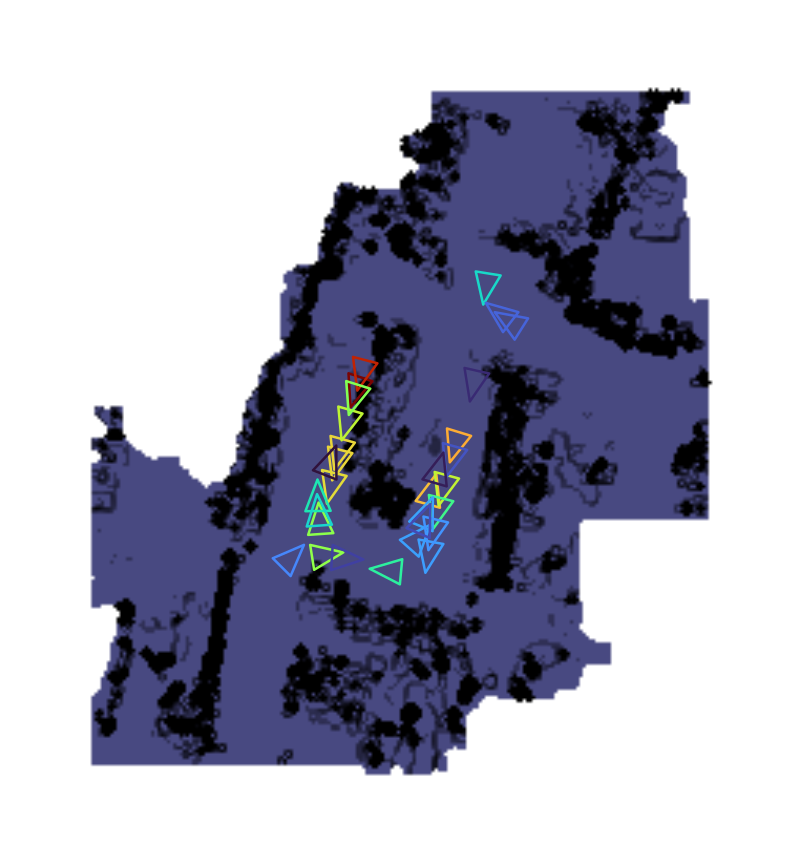
We don't really have to deal with the whole global map actually, let's get top 10 embeddings, and render only lidar around those.
```python
from dimos.models.embedding.clip import CLIPModel
from dimos.mapping.voxels.module import VoxelMapTransformer
drawing = Space()
# this is defined here, but not executed
matches = store.streams.color_image_embedded.search(search_vector, k=30)
print(matches) # Stream("color_image_embedded") | vector_search(k=50)
# here we execute it once, and feed it into a global mapper, then draw the map
drawing.add(
matches.map(lambda obs: store.streams.lidar.at(obs.ts).last()) \
.transform(VoxelMapTransformer()) \
.last().data)
# then we add matches to the map
drawing.add(matches)
drawing.to_svg("assets/embedding_focused.svg")
```
```results
Stream("color_image_embedded") | vector_search(k=30)
12:35:32.400 [inf][dimos/mapping/voxels/grid.py ] VoxelGrid using device: CUDA:0
```
Python
```python
import matplotlib
import matplotlib.pyplot as plt
import math
def plot_mosaic(frames, path, cols=5):
matplotlib.use("Agg")
rows = math.ceil(len(frames) / cols)
aspect = frames[0].width / frames[0].height
fig_w, fig_h = 12, 12 * rows / (cols * aspect)
fig, axes = plt.subplots(rows, cols, figsize=(fig_w, fig_h))
fig.patch.set_facecolor("black")
for i, ax in enumerate(axes.flat):
if i < len(frames):
ax.imshow(frames[i].data)
for spine in ax.spines.values():
spine.set_color("black")
spine.set_linewidth(0)
ax.set_xticks([])
ax.set_yticks([])
else:
ax.axis("off")
plt.subplots_adjust(wspace=0.02, hspace=0.02, left=0, right=1, top=1, bottom=0)
plt.savefig(path, facecolor="black", dpi=100, bbox_inches="tight", pad_inches=0)
plt.close()
```
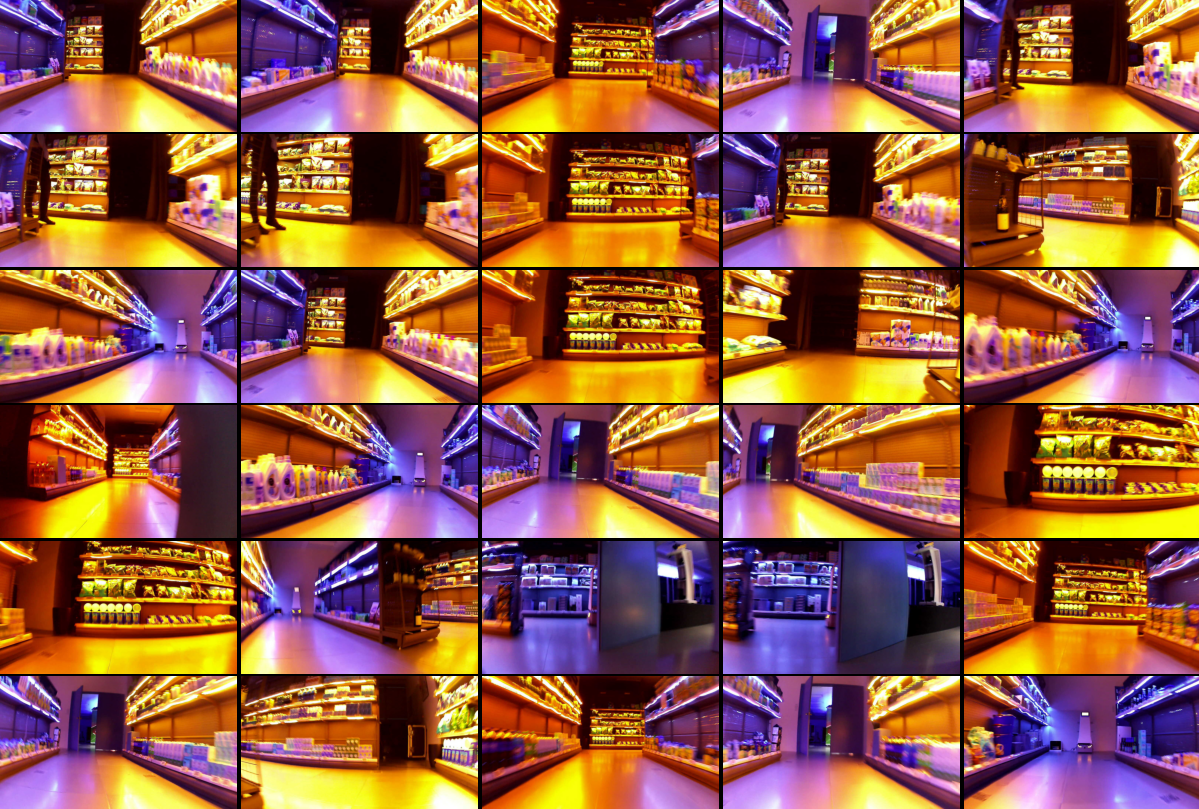
let's view those images
```python
plot_mosaic(matches.map(lambda obs: obs.data).to_list(), "assets/grid.png")
```