Executable Code Blocks
We use md-babel-py to execute code blocks in markdown and insert results.
Golden Rule
All code blocks must be executable. Never write illustrative/pseudo code blocks. If you're showing an API usage pattern, create a minimal working example that actually runs. This ensures documentation stays correct as the codebase evolves.
Running
md-babel-py run document.md          # edit in-place
md-babel-py run document.md --stdout # preview to stdout
md-babel-py run document.md --dry-run # show what would run
Supported Languages
Python, Shell (sh), Node.js, plus visualization: Matplotlib, Graphviz, Pikchr, Asymptote, OpenSCAD, Diagon.
Code Block Flags
Add flags after the language identifier:
| Flag | Effect |
|---|---|
session=NAME | Share state between blocks with same session name |
output=path.png | Write output to file instead of inline |
no-result | Execute but don't insert result |
skip | Don't execute this block |
expected-error | Block is expected to fail |
Use skip when a block would pull in CUDA / GPU-only stacks (for example perception models, VoxelGridMapper defaults, or imports that load torch with GPU expectations), or when it is flaky in CI (multi-module coordinators, timing-sensitive workers, pytest-style snippets that are not meant to run as a single script). Prefer expected-error only when the block is supposed to fail and you want to assert that failure.
Examples
md-babel-py
Execute code blocks in markdown files and insert the results.
Use cases: - Keep documentation examples up-to-date automatically - Validate code snippets in docs actually work - Generate diagrams and charts from code in markdown - Literate programming with executable documentation
Languages
Shell
Python
Sessions preserve state between code blocks:
Node.js
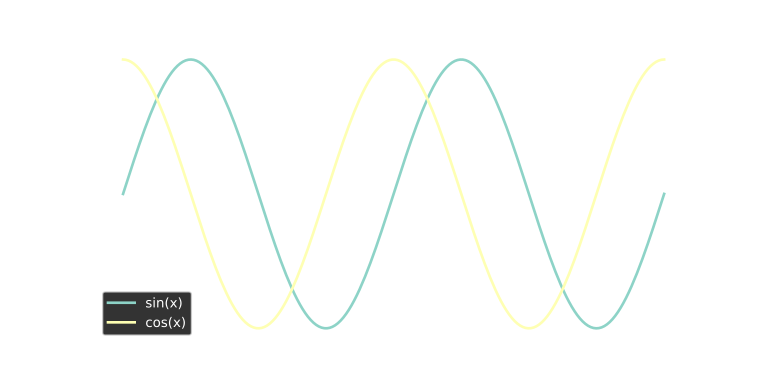
Matplotlib
import matplotlib
matplotlib.use('Agg')
import matplotlib.pyplot as plt
import numpy as np
plt.style.use('dark_background')
x = np.linspace(0, 4 * np.pi, 200)
plt.figure(figsize=(8, 4))
plt.plot(x, np.sin(x), label='sin(x)', linewidth=2)
plt.plot(x, np.cos(x), label='cos(x)', linewidth=2)
plt.xlabel('x')
plt.ylabel('y')
plt.legend()
plt.grid(alpha=0.3)
plt.savefig('{output}', transparent=True)
Pikchr
SQLite's diagram language:
diagram source
color = white
fill = none
linewid = 0.4in

# Input file
In: file "README.md" fit
arrow

# Processing
Parse: box "Parse" rad 5px fit
arrow
Exec: box "Execute" rad 5px fit

# Fan out to languages
arrow from Exec.e right 0.3in then up 0.4in then right 0.3in
Sh: oval "Shell" fit
arrow from Exec.e right 0.3in then right 0.3in
Node: oval "Node" fit
arrow from Exec.e right 0.3in then down 0.4in then right 0.3in
Py: oval "Python" fit

# Merge back
X: dot at (Py.e.x + 0.3in, Node.e.y) invisible
line from Sh.e right until even with X then down to X
line from Node.e to X
line from Py.e right until even with X then up to X
Out: file "README.md" fit with .w at (X.x + 0.3in, X.y)
arrow from X to Out.w

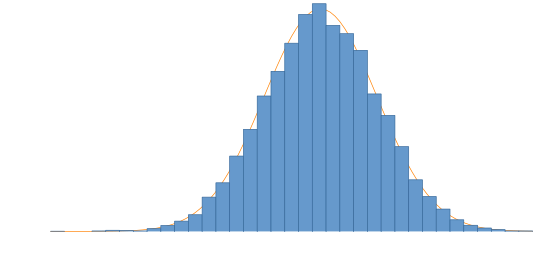
Asymptote
Vector graphics:
import graph;
import stats;

size(400,200,IgnoreAspect);
defaultpen(white);

int n=10000;
real[] a=new real[n];
for(int i=0; i < n; ++i) a[i]=Gaussrand();

draw(graph(Gaussian,min(a),max(a)),orange);

int N=bins(a);

histogram(a,min(a),max(a),N,normalize=true,low=0,rgb(0.4,0.6,0.8),rgb(0.2,0.4,0.6),bars=true);

xaxis("$x$",BottomTop,LeftTicks,p=white);
yaxis("$dP/dx$",LeftRight,RightTicks(trailingzero),p=white);
Graphviz

Diagon
ASCII art diagrams:
Install
Nix (recommended)
# Run directly from GitHub
nix run github:leshy/md-babel-py -- run README.md --stdout

# Or clone and run locally
nix run . -- run README.md --stdout
Docker
# Pull from Docker Hub
docker run -v $(pwd):/work lesh/md-babel-py:main run /work/README.md --stdout

# Or build locally via Nix
nix build .#docker     # builds tarball to ./result
docker load < result   # loads image from tarball
docker run -v $(pwd):/work md-babel-py:latest run /work/file.md --stdout
pipx
If not using nix or docker, evaluators require system dependencies:
| Language | System packages |
|---|---|
| python | python3 |
| node | nodejs |
| dot | graphviz |
| asymptote | asymptote, texlive, dvisvgm |
| pikchr | pikchr |
| openscad | openscad, xvfb, imagemagick |
| diagon | diagon |
# Arch Linux
sudo pacman -S python nodejs graphviz asymptote texlive-basic openscad xorg-server-xvfb imagemagick

# Debian/Ubuntu
sudo apt-get install python3 nodejs graphviz asymptote texlive xvfb imagemagick openscad
Note: pikchr and diagon may need to be built from source. Use Docker or Nix for full evaluator support.
Usage
# Edit file in-place
md-babel-py run document.md

# Output to separate file
md-babel-py run document.md --output result.md

# Print to stdout
md-babel-py run document.md --stdout

# Only run specific languages
md-babel-py run document.md --lang python,sh

# Dry run - show what would execute
md-babel-py run document.md --dry-run

# Longer subprocess limit (default 60s); see upstream README for MD_BABEL_EXECUTION_TIMEOUT
md-babel-py run document.md --execution-timeout 120